
Before you get started, take this readiness quiz.
Do you remember what it means for a number to be a solution to an equation? A solution of an equation is a value of a variable that makes a true statement when substituted into the equation.
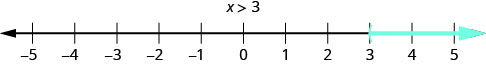
What about the solution of an inequality? What number would make the inequality \(x > 3\) true? Are you thinking, ‘x could be 4’? That’s correct, but x could be 5 too, or 20, or even 3.001. Any number greater than 3 is a solution to the inequality \(x > 3\).
We show the solutions to the inequality \(x > 3\) on the number line by shading in all the numbers to the right of 3, to show that all numbers greater than 3 are solutions. Because the number 3 itself is not a solution, we put an open parenthesis at 3. The graph of \(x > 3\) is shown in Figure \(\PageIndex\). Please note that the following convention is used: light blue arrows point in the positive direction and dark blue arrows point in the negative direction.
 than 3 is graphed on the number line, with an open parenthesis at x equals 3, and a red line extending to the right of the parenthesis." />
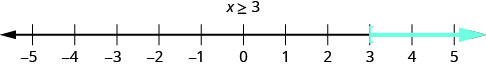
The graph of the inequality \(x \geq 3\) is very much like the graph of \(x > 3\), but now we need to show that 3 is a solution, too. We do that by putting a bracket at \(x = 3\), as shown in Figure \(\PageIndex\).
 the number line, with an open bracket at x equals 3, and a red line extending to the right of the bracket." />
Notice that the open parentheses symbol, (, shows that the endpoint of the inequality is not included. The open bracket symbol, [, shows that the endpoint is included.
Graph on the number line:
 the number line, with an open bracket at x equals 1, and a red line extending to the left of the bracket." />
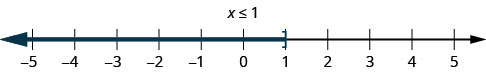
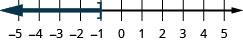
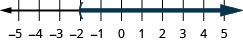
1. \(x\leq 1\) This means all numbers less than or equal to 1. We shade in all the numbers on the number line to the left of 1 and put a bracket at x=1 to show that it is included.
 the number line, with an open parenthesis at x equals 5, and a red line extending to the right of the parenthesis." />
2. \(x
 the number line, with an open parenthesis at x equals negative 1, and a red line extending to the right of the parenthesis." />
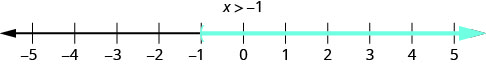
3. \(x>−1\) This means all numbers greater than −1, but not including −1. We shade in all the numbers on the number line to the right of −1, then put a parenthesis at x=−1 to show it is not included.
Graph on the number line:
 the number line, with an open bracket at x equals negative 1, and a dark line extending to the left of the bracket." />
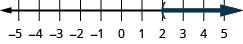 the number line, with an open parenthesis at x equals 2, and a dark line extending to the right of the parenthesis." />
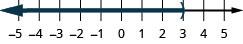 than 3 is graphed on the number line, with an open parenthesis at x equals 3, and a dark line extending to the left of the parenthesis." />
Graph on the number line:
 the number line, with an open parenthesis at x equals negative 2, and a dark line extending to the right of the parenthesis." />
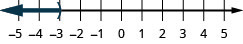 the number line, with an open parenthesis at x equals negative 3, and a dark line extending to the left of the parenthesis." />
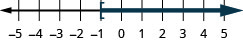 the number line, with an open bracket at x equals negative 1, and a dark line extending to the right of the bracket." />
We can also represent inequalities using interval notation. As we saw above, the inequality \(x>3\) means all numbers greater than 3. There is no upper end to the solution to this inequality. In interval notation, we express \(x>3\) as \((3, \infty)\). The symbol \(\infty\) is read as ‘infinity’. It is not an actual number. Figure \(\PageIndex\) shows both the number line and the interval notation.
 than 3 is graphed on the number line, with an open parenthesis at x equals 3, and a red line extending to the right of the parenthesis. The inequality is also written in interval notation as parenthesis, 3 comma infinity, parenthesis." />
The inequality \(x\leq 1\) means all numbers less than or equal to 1. There is no lower end to those numbers. We write \(x\leq 1\) in interval notation as \((-\infty, 1]\). The symbol \(-\infty\) is read as ‘negative infinity’. Figure \(\PageIndex\) shows both the number line and interval notation.
 the number line, with an open bracket at x equals 1, and a red line extending to the left of the bracket. The inequality is also written in interval notation as parenthesis, negative infinity comma 1, bracket." />
 the left of the parenthesis. The inequality is also written in interval notation as parenthesis, negative infinity comma a, parenthesis. The inequality x is less than or equal to a is graphed on the last number line, with an open bracket at x equals a, and a red line extending to the left of the bracket. The inequality is also written in interval notation as parenthesis, negative infinity comma a, bracket." />
Did you notice how the parenthesis or bracket in the interval notation matches the symbol at the endpoint of the arrow? These relationships are shown in Figure \(\PageIndex\).
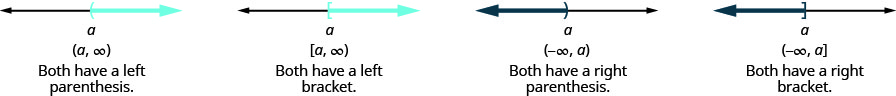 the number lines is similar to the interval notation. The first number line is a graph of x is greater than a, and the interval notation is parenthesis, a comma infinity, parenthesis. The text below reads: “Both have a left parenthesis.” The second number line is a graph of x is greater than or equal to a, and the interval notation is bracket, a comma infinity, parenthesis. The text below reads: “Both have a left bracket.” The third number line is a graph of x is less than a, and the interval notation is parenthesis, negative infinity comma a, parenthesis. The text below reads: “Both have a right parenthesis.” The last number line is a graph of x is less than or equal to a, and the interval notation is parenthesis, negative infinity comma a, bracket. The text below reads: “Both have a right bracket.”" />
Graph on the number line and write in interval notation.
 | |
| Shade to the right of −3, and put a bracket at −3. | 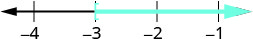 |
| Write in interval notation. |  |
 | |
| Shade to the left of 2.5, and put a parenthesis at 2.5. | 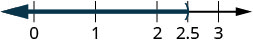 |
| Write in interval notation. |  |
 | |
| Shade to the left of \(-\frac\), and put a bracket at \(-\frac\). | 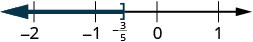 |
| Write in interval notation. |  |
Graph on the number line and write in interval notation:
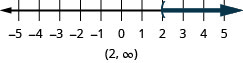 the number line, with an open parenthesis at x equals 2, and a dark line extending to the right of the parenthesis. The inequality is also written in interval notation as parenthesis, 2 comma infinity, parenthesis." />
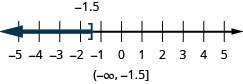 the number line, with an open bracket at x equals negative 1.5, and a dark line extending to the left of the bracket. The inequality is also written in interval notation as parenthesis, negative infinity comma negative 1.5, bracket." />
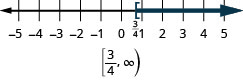 the number line, with an open bracket at x equals 3/4, and a dark line extending to the right of the bracket. The inequality is also written in interval notation as bracket, 3/4 comma infinity, parenthesis." />
Graph on the number line and write in interval notation:
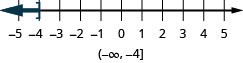 the number line, with an open bracket at x equals negative 4, and a dark line extending to the left of the bracket. The inequality is also written in interval notation as parenthesis, negative infinity comma negative 4, bracket." />
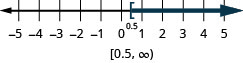 the number line, with an open bracket at x equals 0.5, and a dark line extending to the right of the bracket. The inequality is also written in interval notation as bracket, o.5 comma infinity, parenthesis." />
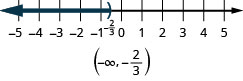 the number line, with an open parenthesis at x equals negative 2/3, and a dark line extending to the left of the parenthesis. The inequality is also written in interval notation as parenthesis, negative infinity comma negative 2/3, parenthesis." />
The Subtraction and Addition Properties of Equality state that if two quantities are equal, when we add or subtract the same amount from both quantities, the results will be equal.